 The Vertex Journal
Economics
The real cost of switching BI tools
The license comparison is the cheapest part of the spreadsheet. Where BI migrations actually spend their budget, and the line items procurement never sees.
By The editors · · 1 min
BI migrations begin with a spreadsheet comparing license costs, and license costs are reliably the smallest number in the eventual total. The rest of the total hides in places procurement does not have a column for.
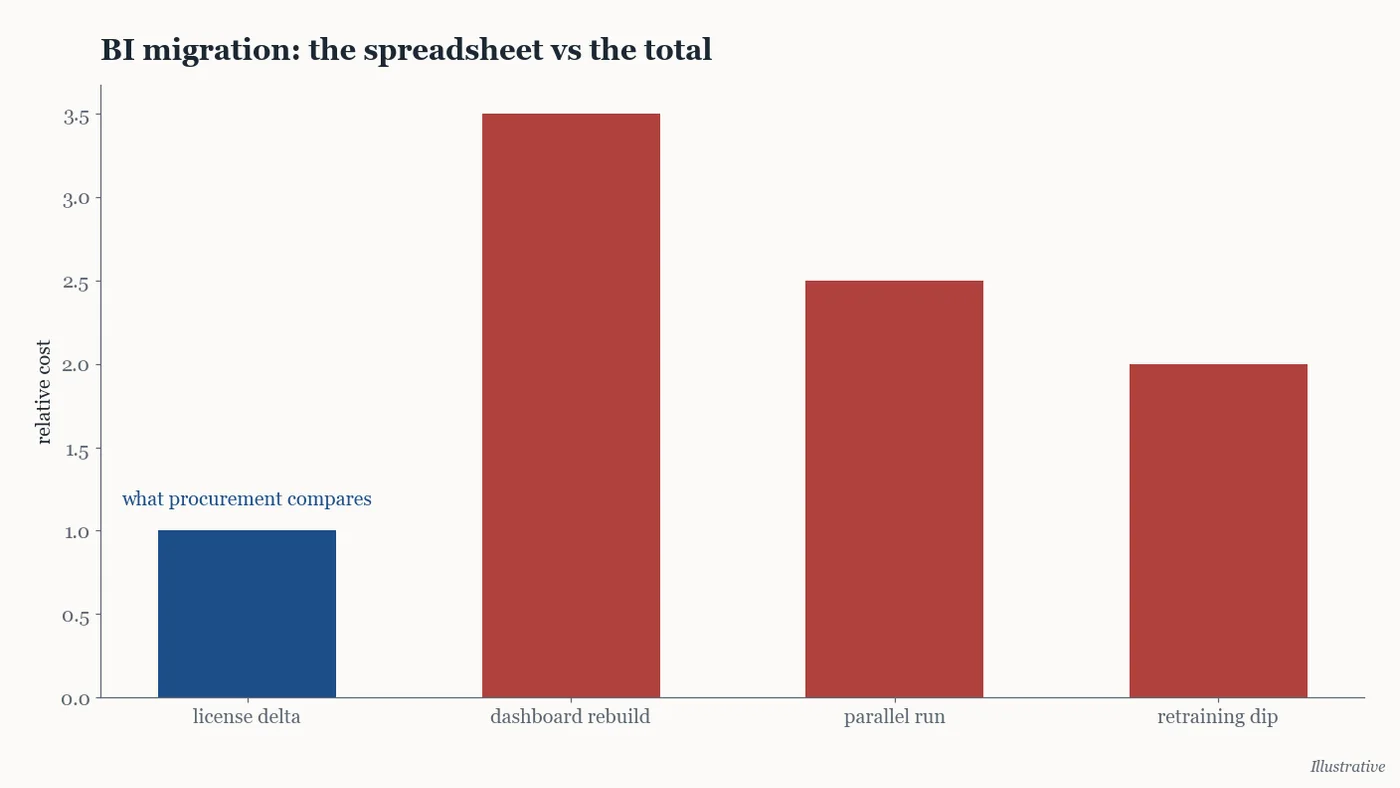
The rebuild is never a port. Dashboards do not transfer; they get recreated, and recreation surfaces every buried assumption: the filter logic nobody documented, the calculated field with the fiscal-year quirk, the extract that patched over a modeling problem in 2021. Plan on rebuilding the twenty dashboards that matter and formally killing the two hundred that do not. The killing, done honestly, is the migration's best return.
The parallel run is mandatory and priced by trust. Old and new tools run side by side while numbers get reconciled, and every discrepancy is presumed to be the new tool's fault. This period ends when the loudest stakeholder says it ends. Budget quarters, not sprints.
Retraining is the sleeper. Analysts carry years of muscle memory and private workarounds. Their productivity dips precisely when the organization is watching the new tool for reasons to distrust it. The dip is temporary; the anecdotes it generates are not.
the part worth doing regardless
Semantic rot is the usual root cause: metric definitions embedded in one tool's calculated fields instead of in a governed layer the next tool could have inherited. Fix that during the migration and the next one gets cheaper. Skip it and you have bought the same migration again, on a five-year subscription.
verdict
Migrate for capability you can name, never for a license delta. The license delta will be spent, several times over, on the columns missing from the spreadsheet.